One of the (many) lovely facets of cycling is that you can measure your progress in an absolute way. No guessing. This challenge gave us a great reason to get more serious in our training approach. We placed 5 test moments in our training schedule that started in November 2017, a year from Mauna Kea. We did three 20 minute FTP tests and two (still one to go) 60 minute FTP tests on Wattbikes. During these tests we also checked up on a couple of other important markers to get a good overview of where we stand.
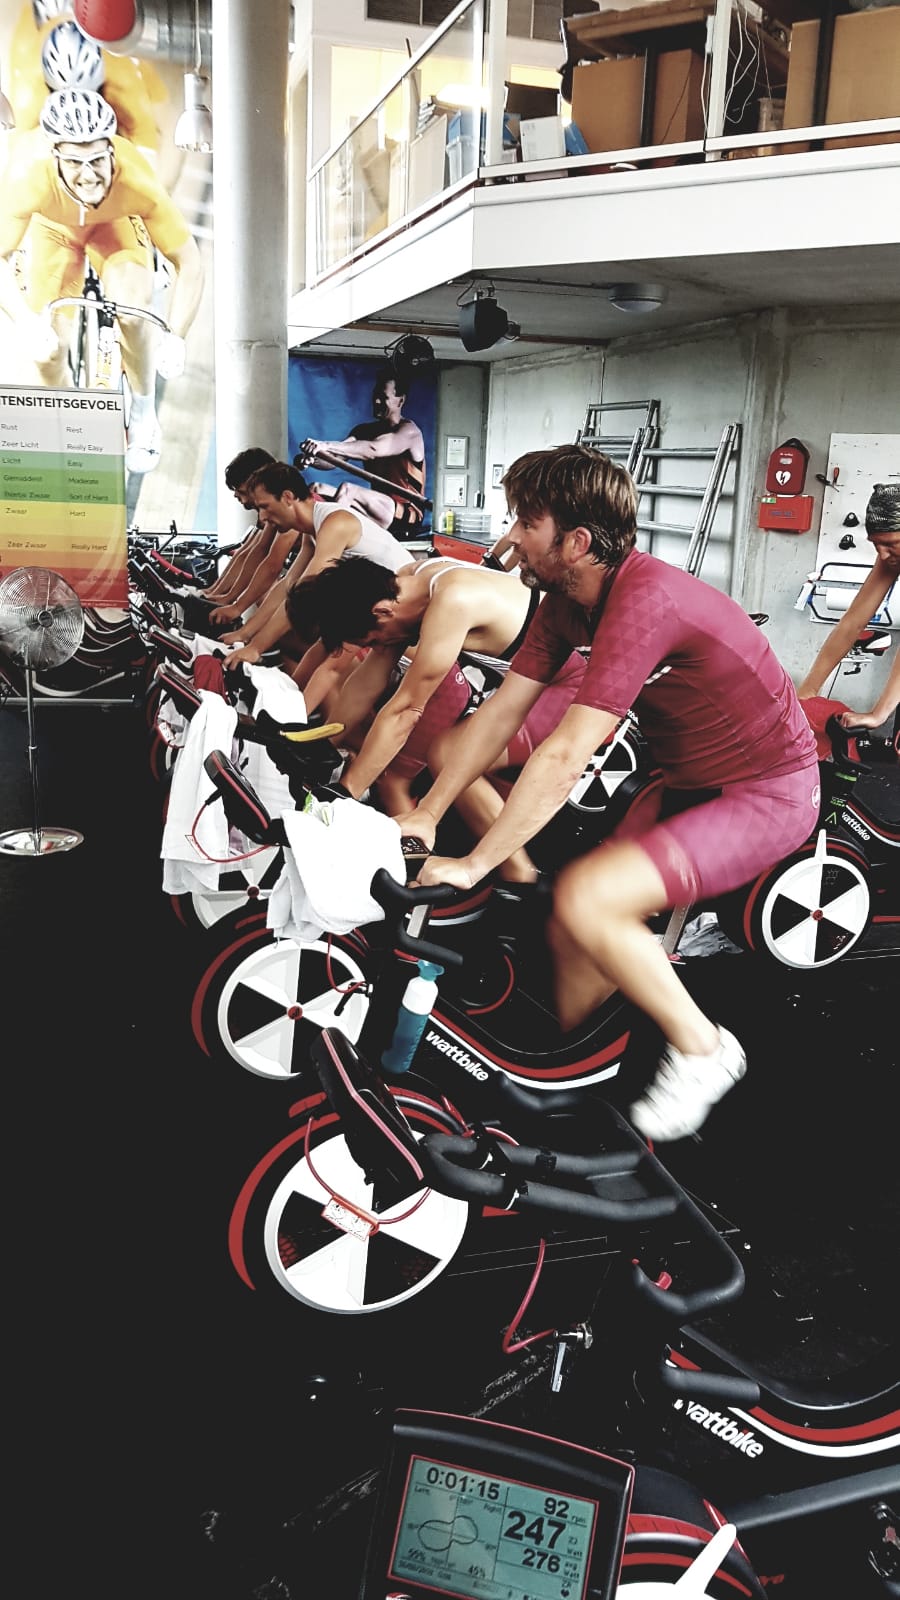 These tests gave us results for absolute power and relative power (power to weight ratio), average and maximal heart rate, pedaling frequency and weight and fat percentage.
So how does that work and what does everything mean? Our results obtained during the first 20 minutes FTP test at the beginning of our challenge is a good way to explain it in short.
At the end we’ll show you how much every rider and the group in total improved in 10 months time :-).
Absolute and relative power
The absolute power is very diverse in our group. In November 2017 our friend Condor achieved 218 watts of power during 20 minutes of pushing as much power on your pedals. And this went all the way up to 366W for Levi, our coach (he could still verbally motivate us during the test, so there probably were some more watts in him).
The yellow stars show the relative power. Absolute power doesn’t mean that much when your challenge is climbing the toughest mountain in the world. Weight is a also major factor (almost just as important as watts). And that’s why they invented relative power. You calculate this number through dividing the absolute power with your weight.
Erwin is at the bottom with the first test with a relative power of 2.5 while Levi stands at 4.5. At the Tour of 2015 Chris Froome had a relative power of 6.25. In the good old EPO days Armstrong reached 7.25 watt/kilo.
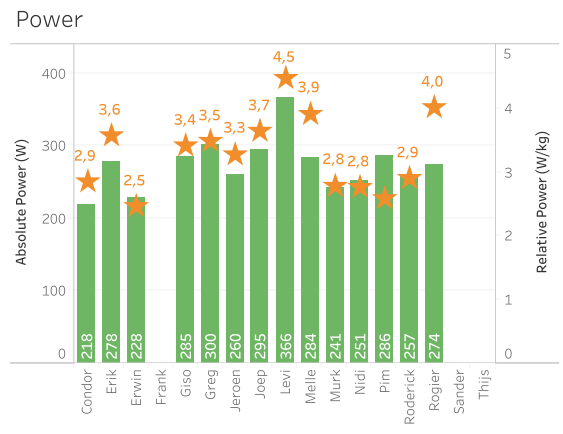
(*not all riders could do the test, so you’ll see some blank spots as well)
Heart Frequency
At the chart below you can see the average heart rate during the first FTP test and the stars show the maximum heart rate of the riders. With a range of 168 beats per minute to 201 beats per minute you see that heart rates can differ quite a lot!
Interesting thing is that heart rate isn’t any performance indicator at all if you use it to compare different riders. For every person it is different and a low or high heart rate doesn’t give you an disadvantage or edge.
What is interesting is your personal heart rate compared to watts pushed. Can you push 250W with a heart rate of 180 in 2017? And you trained a lot in 2018? Your heart rate will drop to 165 for example when you push the same amount of watts a year later. This will show you’re now much fitter!

Pedaling frequency
We go from a low of 77 rotations per minute (rpm) of Rogier to a high of 107 rpm of Jeroen. You have pro’s with a low rpm, think Jan Ullrich, and a very high one like Froome. Most coaches will tell you that a high rpm is better because it increases the blood flow to the muscles (you have more muscle contractions per minute with a higher rpm)

Body composition
We have some lightweights and heavyweights in our group. Rogiers scale showed 68 kilo (16% fat percentage) during the first test while Pim has some more weight to carry upwards Mauna Kea with his 110 kilo (31% fat percentage).
It’s our goal to gain more power until November 2018 but also to lose as much weight as possible! For a comparison: Froome weighted 62 kilo with a fat percentage of 5% when he won the Tour. 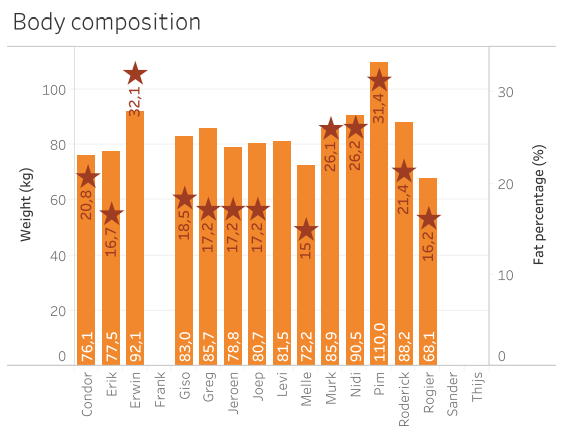 Our improvement in 10 months!
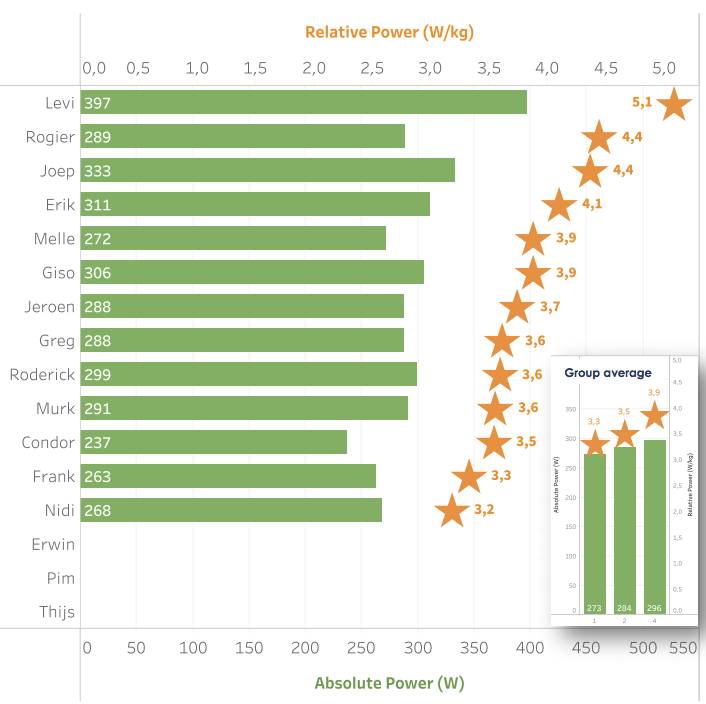
Some guys trained a lot, some did much less (1,000km vs 7,500km ridden). It all depended on time available and the personal goals. But everybody trained much more than the year before. This training lead to a jump of….. 18.2% in relative power for the whole group in 10 months!
Below you see the results of three 20 minute FTP tests. Test nr 3 is a 60 minute FTP test, that’s why we left that one out.

Here you can see the ranking of our group based on the relative power achieved in the last 20 minute FTP test:
And to be super transparant, yes we truly have no secrets (ok, pssssttt, maybe cafeine pills, red beets and drinking whey protein after training), here all the numbers of all the tests so far:
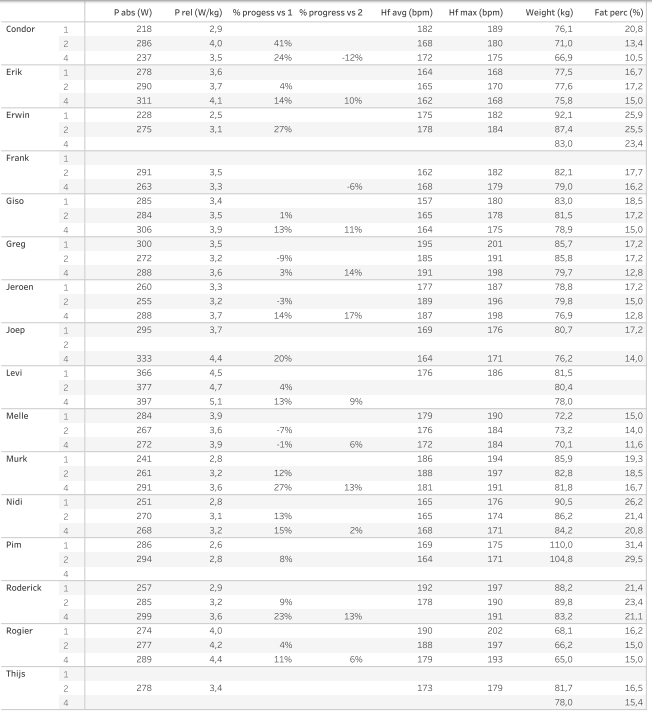 Do you have any idea what your numbers are? How would you compare with our group members? :-).


Want to see more pictures and get little updates? Follow us on our social media channels